Reflecting on 2020 US Science Progress
The survey sample was weighted by gender and academic field to represent the population as closely as possible. The measure of sampling error for questions answered by the full sample is plus or minus 5 percentage points.
We asked scientists to rate the amount of progress made by the U.S. on 22 science and technology topics over the past 12 months.
The following graphs show the top 10 topics overall, followed by the top-ranked issues grouped into three topic areas: science practice, science communication, and science policy.
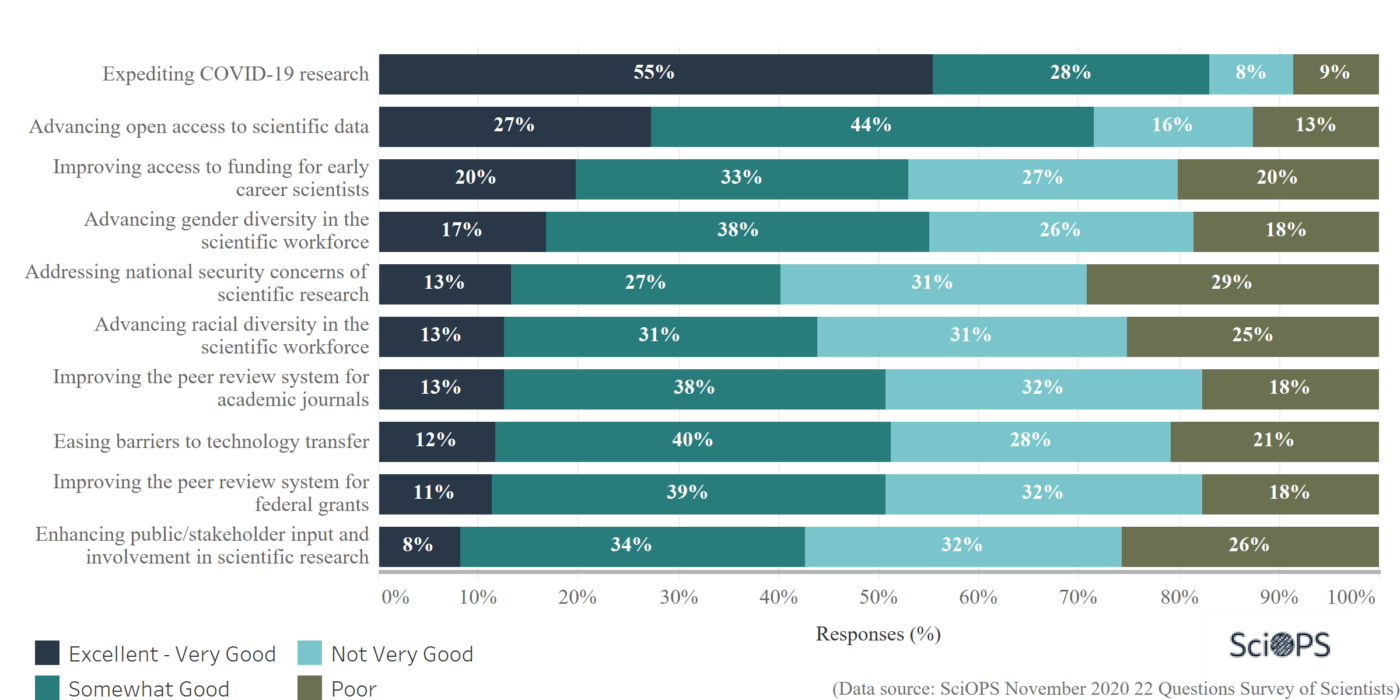
The only field in which most scientists believe that “Excellent” of “Very good” progress has been made over the last 12 months is the COVID-19 research one (55%). The second area in which scientists believe the greatest progress has been made in 2020 is “Advancing open access to scientific data” (27%).
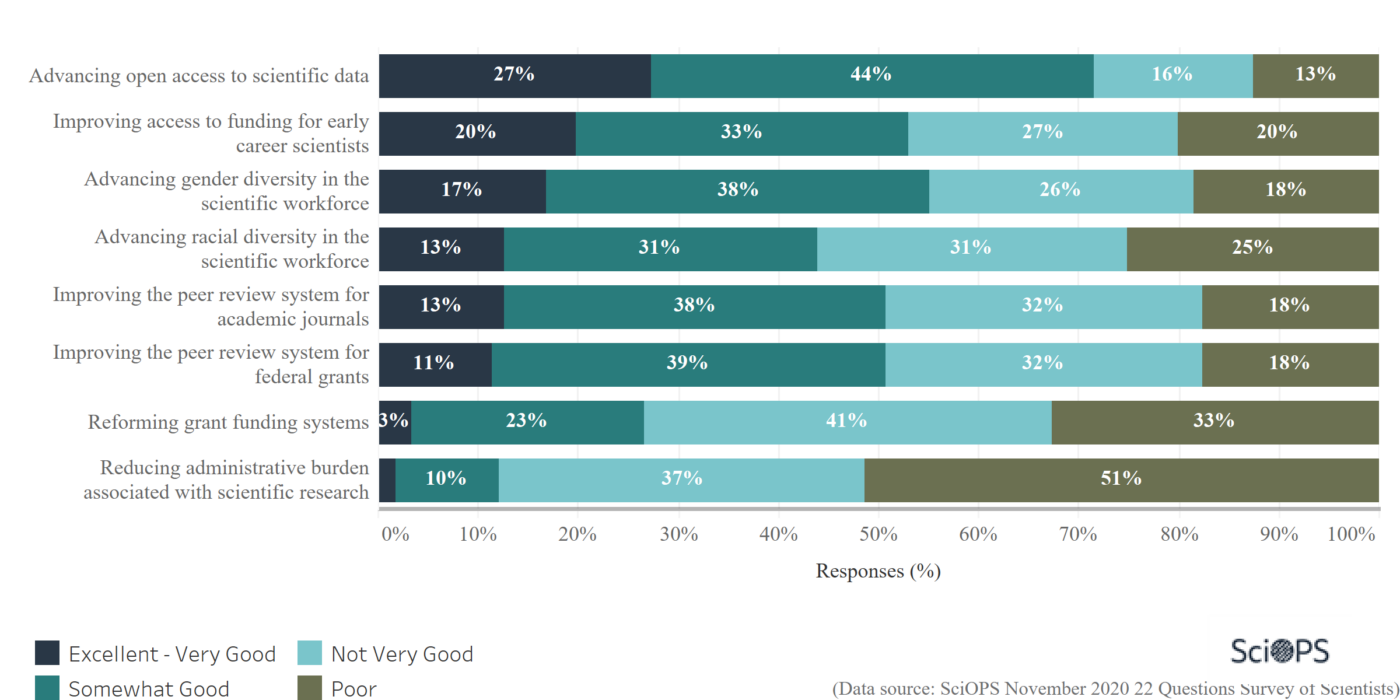
Most respondents (51%) believe that poor progress has been made to reduce the administrative burden associated with scientific research.
A third of the respondents (33%), reported poor progress has been made to the reform of the grant funding system.
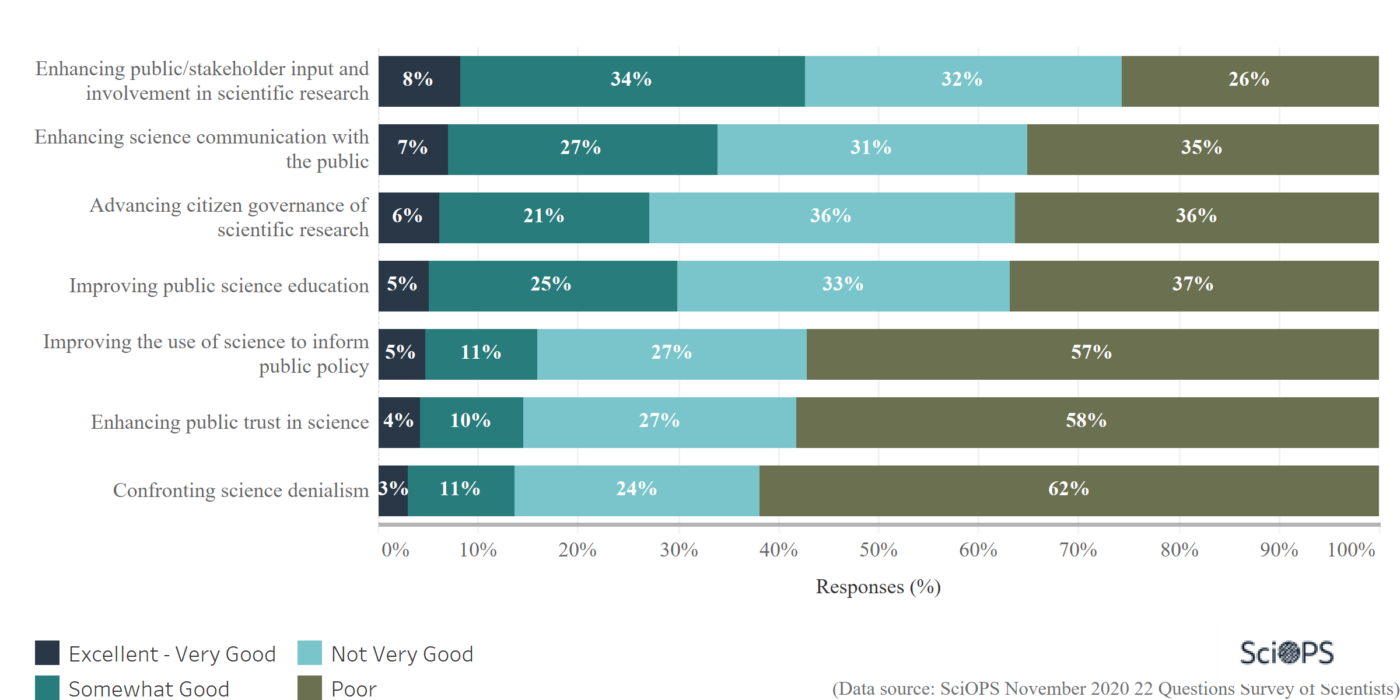
Most respondents agree that little progress has been made on science communication issues within the last 12 months.
Very few scientists (8%) reported that excellent or very good progress has been made to enhance public/stakeholder inputs and involvement in scientific research.
More than half of respondents feel that progress to address science denialism (62%) or enhance public trust in science (58%) has been poor.
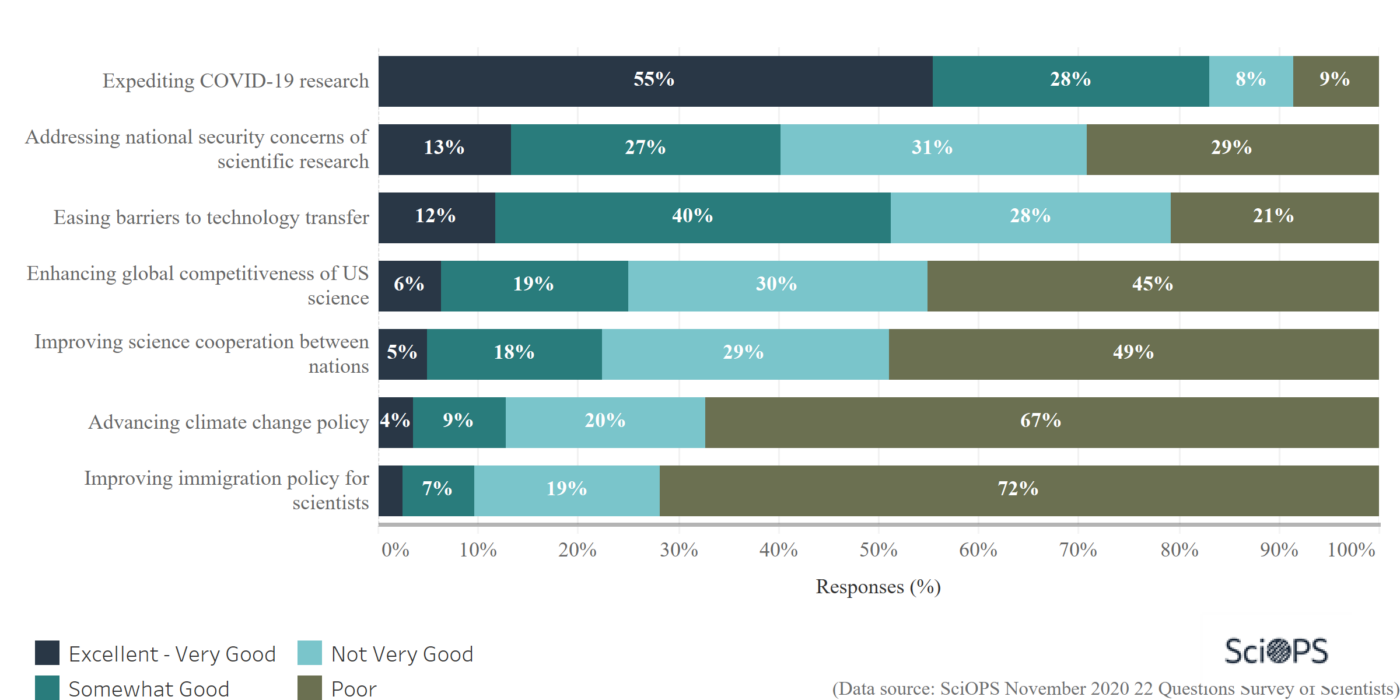
Over half (55%)of respondents believe that expediting COVID-19 research has been considered as the area in which the greatest progress has been made in 2020.
Conversely, almost three-quarters of scientists (72%) believe that in 2020, poor progress was made to improve the immigration policy for scientists.
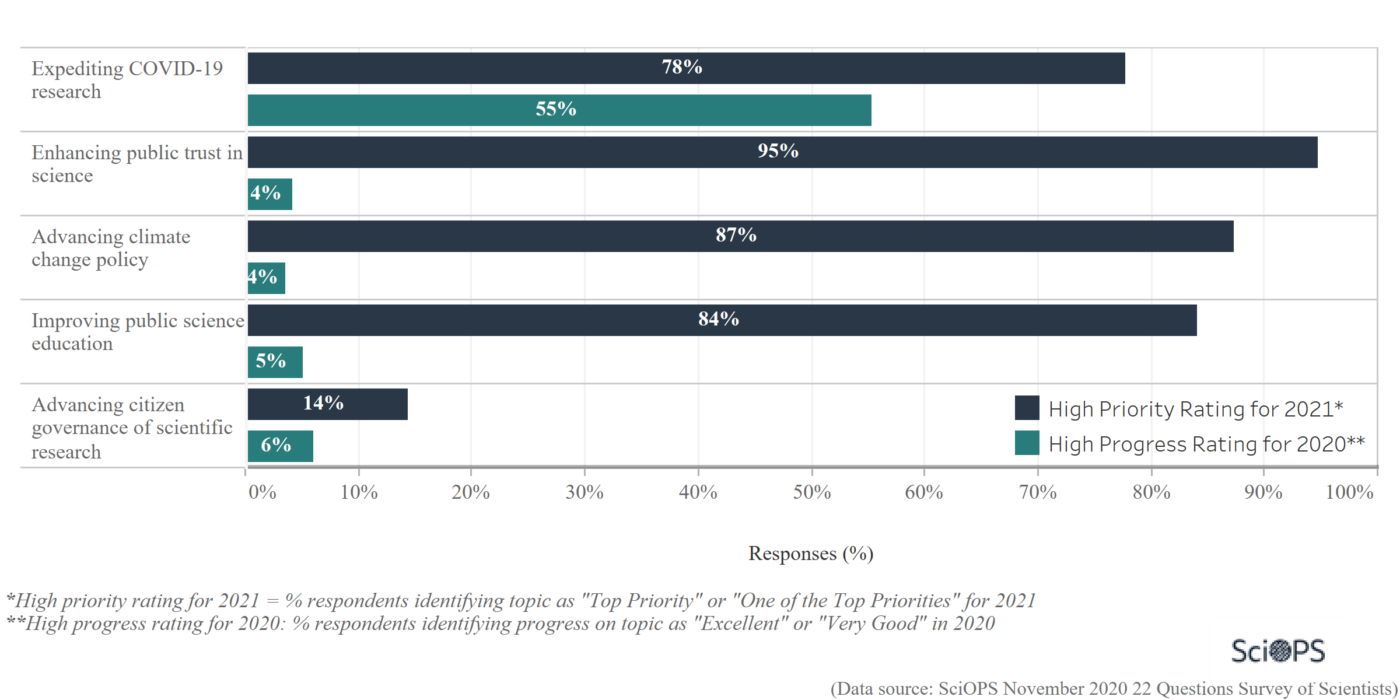
Respondents reported that expediting COVID-19 research was the area in which the greatest progress has been made, but also continues to be one of the top priorities for 2021.
95% of the scientists believe that enhancing public trust in science should be considered a top priority or one of the top priorities in 2021, even though only 4% of the respondents believed excellent or very good progress was made in this area over the last 12 months.
Survey Description
This national survey on science, technology and society 2020 events and priorities was conducted by the Center for Science, Technology and Environmental Policy Studies at Arizona State University. The population for the survey represents a random sample of academic scientists (tenured, tenure-track and non-tenure-track) who work in three departments three subfields (biology, civil and environmental engineering, and geography) at 60 randomly selected universities classified as Carnegie designated research extensive (R1) universities in the United States. The online survey was administered in English using Sawtooth Software®. A total of 2,436 individuals were invited to participate in the survey via email invitations with a series of personalized email follow-up reminders. Survey invitations were sent on October 21, 22 and 23, followed by three reminder messages. The survey was closed on November 23rd.
A total of 451 usable responses were obtained, representing an AAPOR response rate (RR4) of 18.8%. The survey sample was weighted by gender and academic field. The measure of sampling error for questions answered by the full sample is plus or minus 5 percentage points. A total of 44 questions were included in the final survey questionnaire. The questionnaire included sections asking about (1) progress that has been made within the U.S. in addressing 22 science and technology topics over the past 12 months; and (2) science and technology topics which should be a priority for the U.S. in 2021. The survey was approved by Institutional Review Boards at Arizona State University and at the University of Illinois at Chicago.
