Science and Media: Opportunities to Share Research with the Broader Public
The survey sample was weighted by gender and academic field to represent the population as closely as possible. The measure of sampling error for questions answered by the full sample is plus or minus 5 percentage points.
This survey, conducted by SciOPS in partnership with AAAS SciLine, is on scientists’ perspectives on science communication and media engagement. This survey aims to understand scientists’ experiences with and opinions about interacting with the news media. The survey covers scientists’ past interview experiences, the benefits, and risks of interacting with media, as well as their perspectives about media communications at their universities. This page displays results from half of the survey, you can view the rest of the survey results here.
Question
For scientists, the three most useful sources for providing information about their research to the broader public are through:
- Newspaper, radio, or television newscasts (60%)
- University websites and social media (46%)
- College or department websites and social media (41%)
Less than one-quarter of the scientists find information from online newsletters sent to listservs (23%) and online platforms such as “The Conversation” (21%) useful for providing information to the broader public.
Question
35% of scientists post online about their research more than once per week, while another 35% only post online one time a year about their research.
One in ten (10%) of the scientists never post online about their research.
Question
Most scientists have never received a follow-up from a newspaper, radio, or television station related to topics that they posted online to their social media pages or personal website (72%).
Question
Slightly more than half of the respondents (51%) follow social media accounts of other scientists.
A gender level analysis shows that female respondents tend to follow other scientists’ social media accounts (57%) more than male respondents (47%).
Question
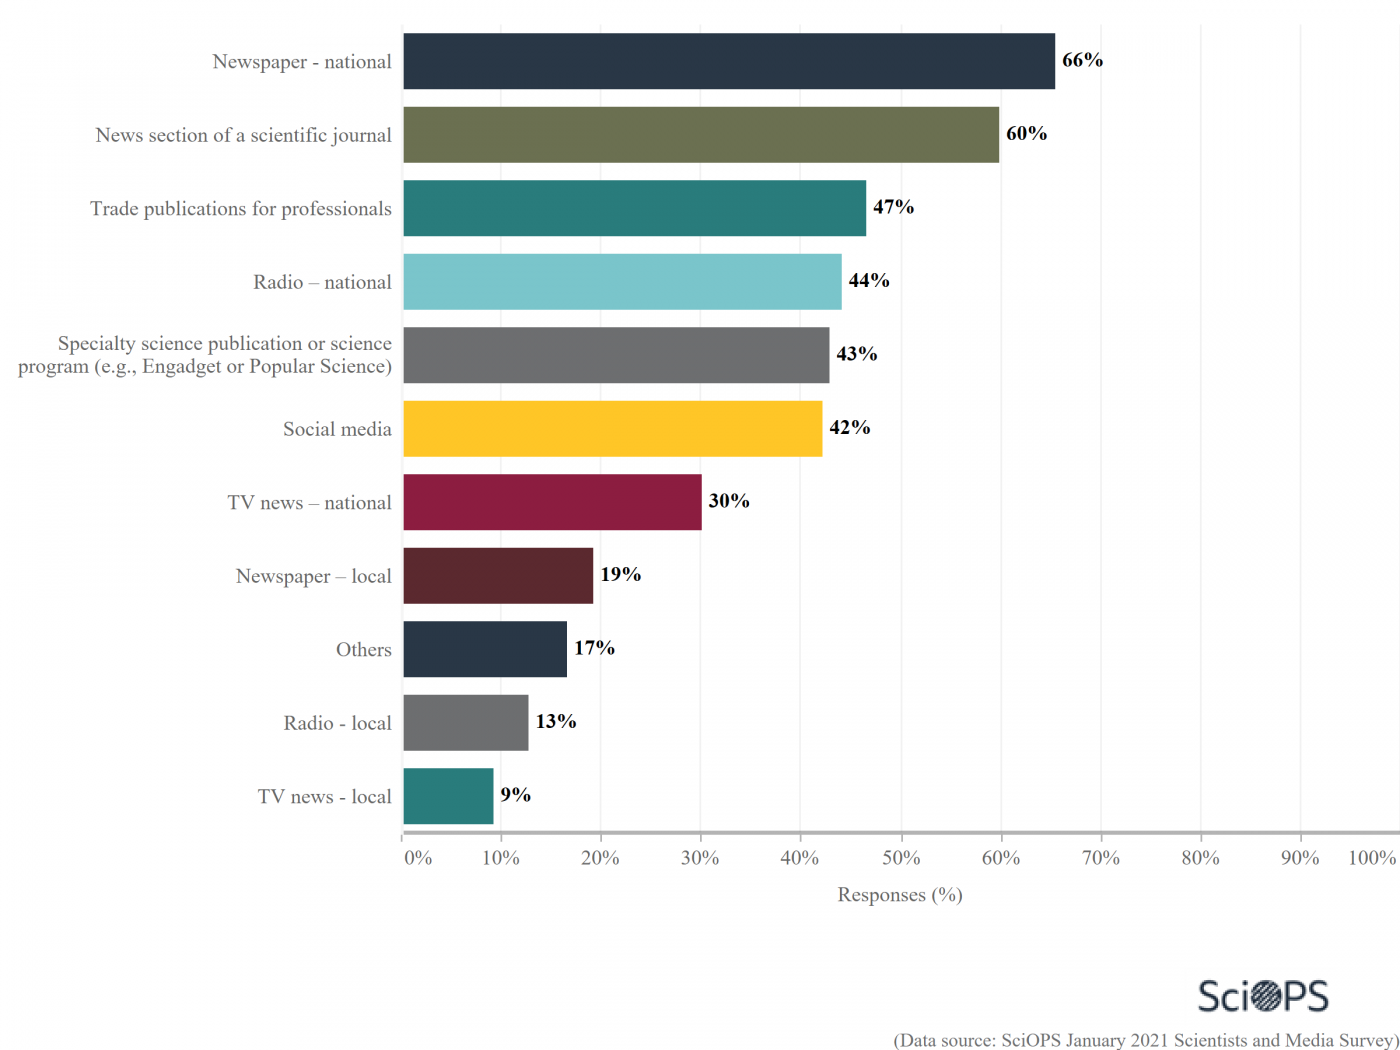
Two-thirds of the scientists (66%) get information from national newspapers, and over one-half (60%) get information from the news section of scientific journals.
Around 21% of scientists get information from local radio and TV news.
Question
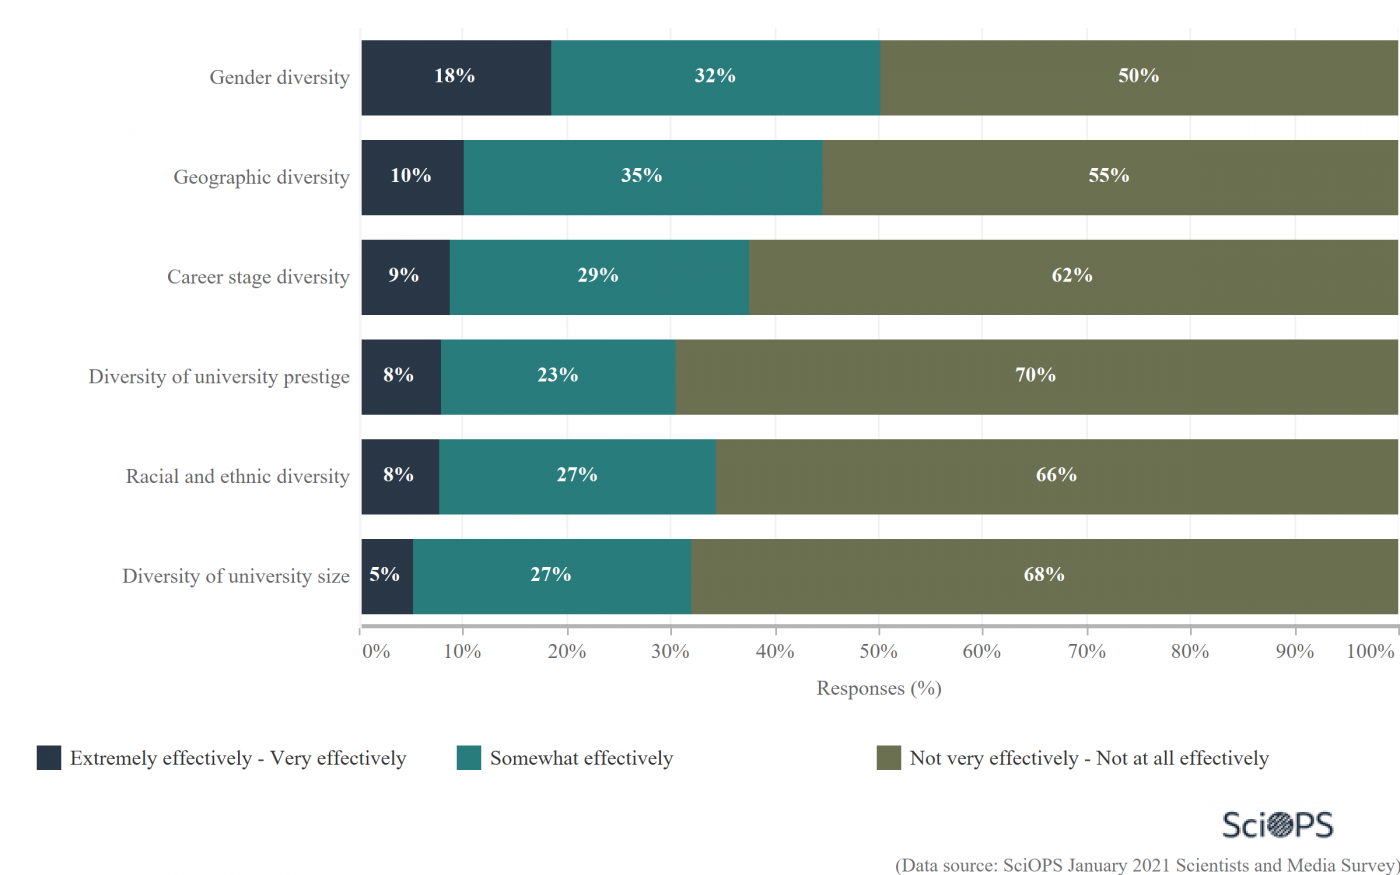
The majority of scientists agree that media coverage of science does not effectively represent the diversity of the scientific community.
Among various aspects of diversity in the science community, gender diversity is the topic that most scientists responded is most effectively covered by media is (18%).
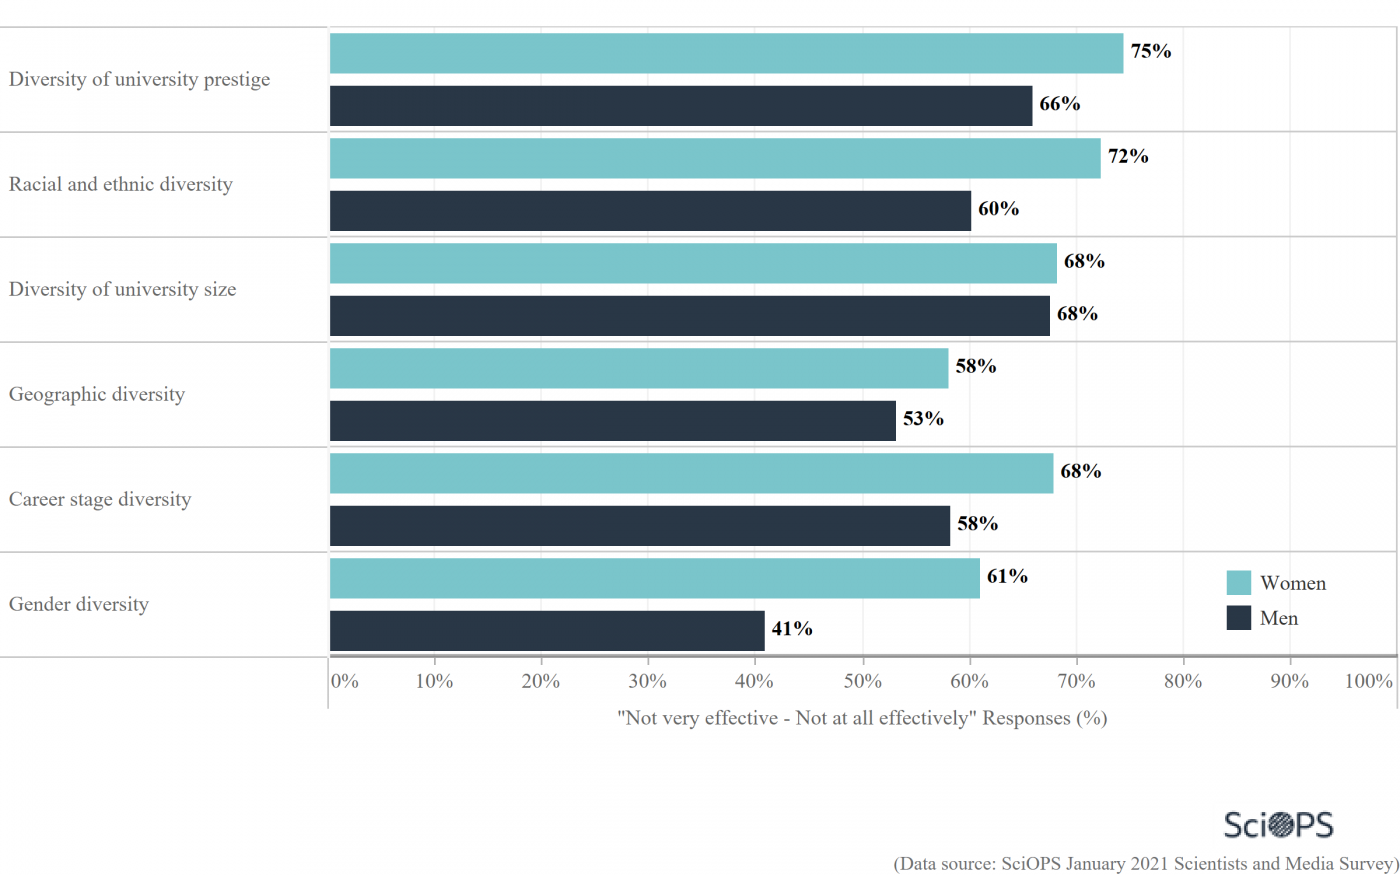
More men (27%) believe that gender diversity topics are extremely effectively or very effectively covered by media as compared to women (12%)
More men (12%) than women (2%) report that racial diversity is effectively covered by media.
Question
In the past month, 86% of respondents have read, heard, or watched a general media report that covers scientific topics in their field.
As compared to biologists (79%), civil engineers (85%), and geographers (87.5%), public health scholars (89%) reported encountering general media reports relate to their field most often.
Question
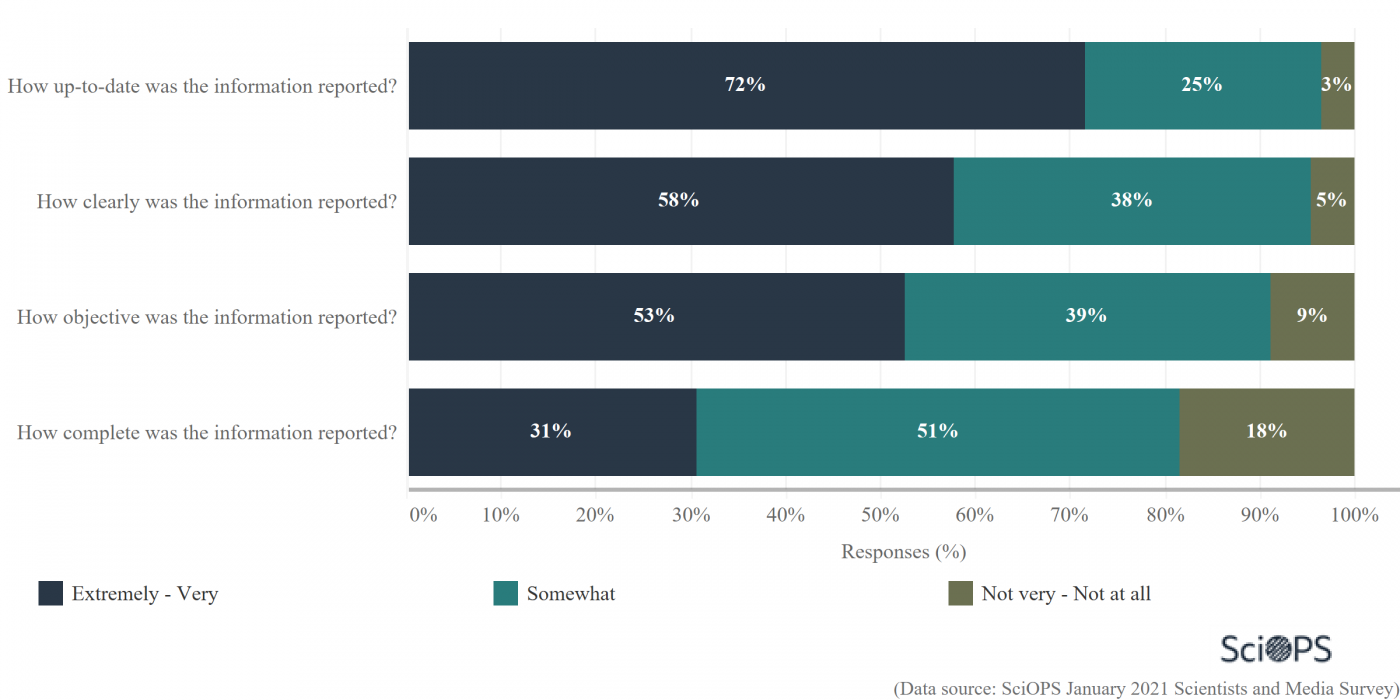
The majority of the scientists responded that the information reported was only somewhat complete (51%). However, the majority also responded that the information was extremely or very up-to-date (72%), clear (58%), and objective (53%).
Survey Description
This national survey on science and media was conducted by the Center for Science, Technology and Environmental Policy Studies at Arizona State University and designed in collaboration with AAAS SciLine. The population for the survey represents a random sample of PhD-level faculty in four fields of science. Three fields– biology and genetics, civil and environmental engineering, and geography –were collected from 81 randomly selected Carnegie-designated Research Extensive and Intensive (R1) universities in the United States (US).
Public health faculty were collected from the full population of 62 universities with an accredited Public Health department. Public Health sub-disciplines included data science and statistics; health practice; science and medicine; social and behavioral sciences; organization, management, and policy. The final sample included contact information for 3,303 scientists. A total of 508 usable responses were obtained, representing an AAPOR response rate (RR4) of 15.5%.
Sample weighting and Precision: the completed sample was weighted by the inverse of selection probabilities and post-stratified by gender and academic field to represent the population as closely as possible. A conservative measure of sampling error for questions answered by the full sample is plus or minus 5 percentage points. The survey was approved by Institutional Review Boards at Arizona State University and at the University of Illinois at Chicago.