COVID-19 Survey III (2022): Policy, Risks & Response
The survey sample was weighted by gender and academic field to represent the population as closely as possible. The measure of sampling error for questions answered by the full sample is plus or minus 5 percentage points.
In this third round survey on COVID-19, we asked scientists about the ways in which their professional and personal lives have been impacted over the past year. We also asked their opinions on policy issues related to the pandemic. You can see results from our first survey in 2020 here and our second survey in 2021 here.
Question
Finding
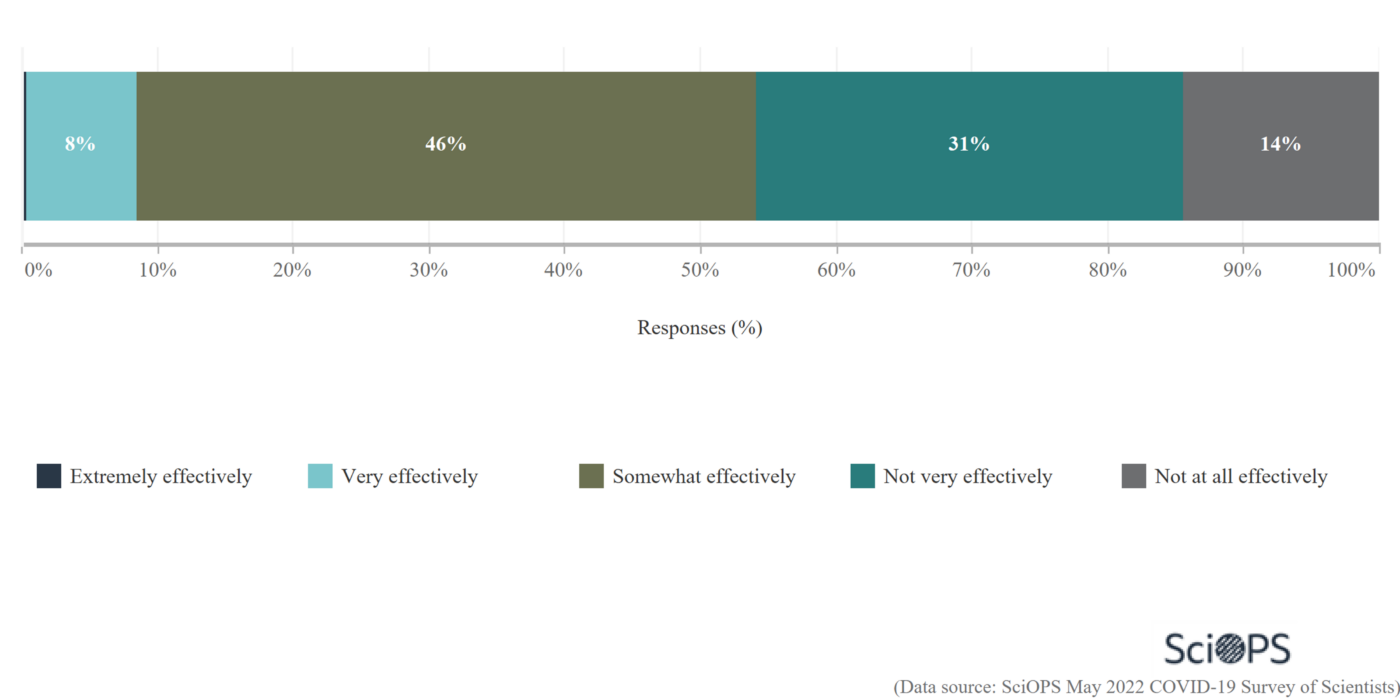
More than half of the respondents (55%) reported that the US government has managed COVID-19 pandemic at least somewhat effectively.
Question
Finding
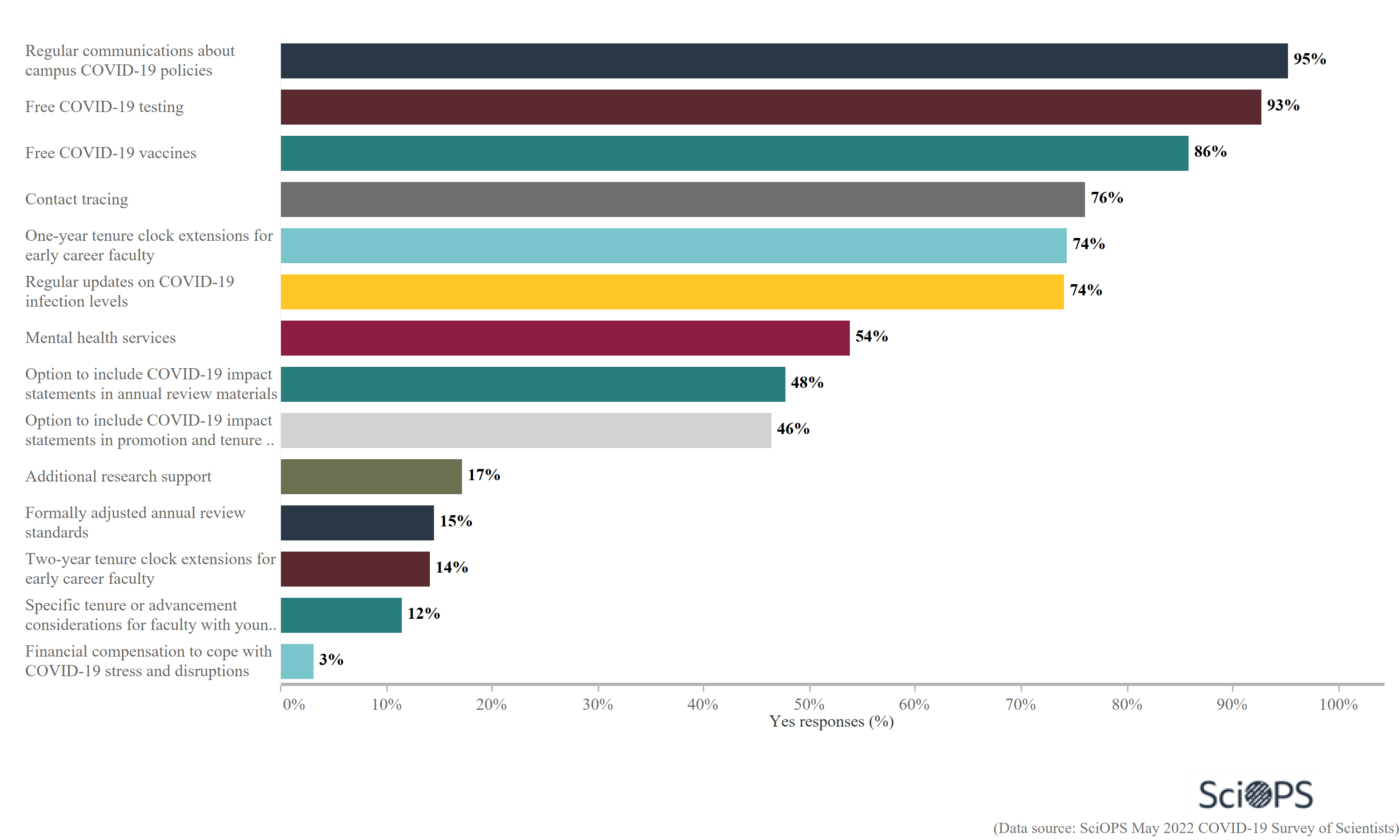
Scientists report that the most common initiatives put in place by universities in response to the pandemic were regular communications about campus COVID-19 policies (95%), free COVID-19 testing (93%) and vaccination (86%).
15% of respondents indicated that universities formally adjusted review standards, and a similar percentage (14%) reported that two-year tenure clock extensions for early career faculty were granted. 3% reported that universities provided financial compensation to cope with the stress and disruptions caused by the pandemic.
Question
Finding
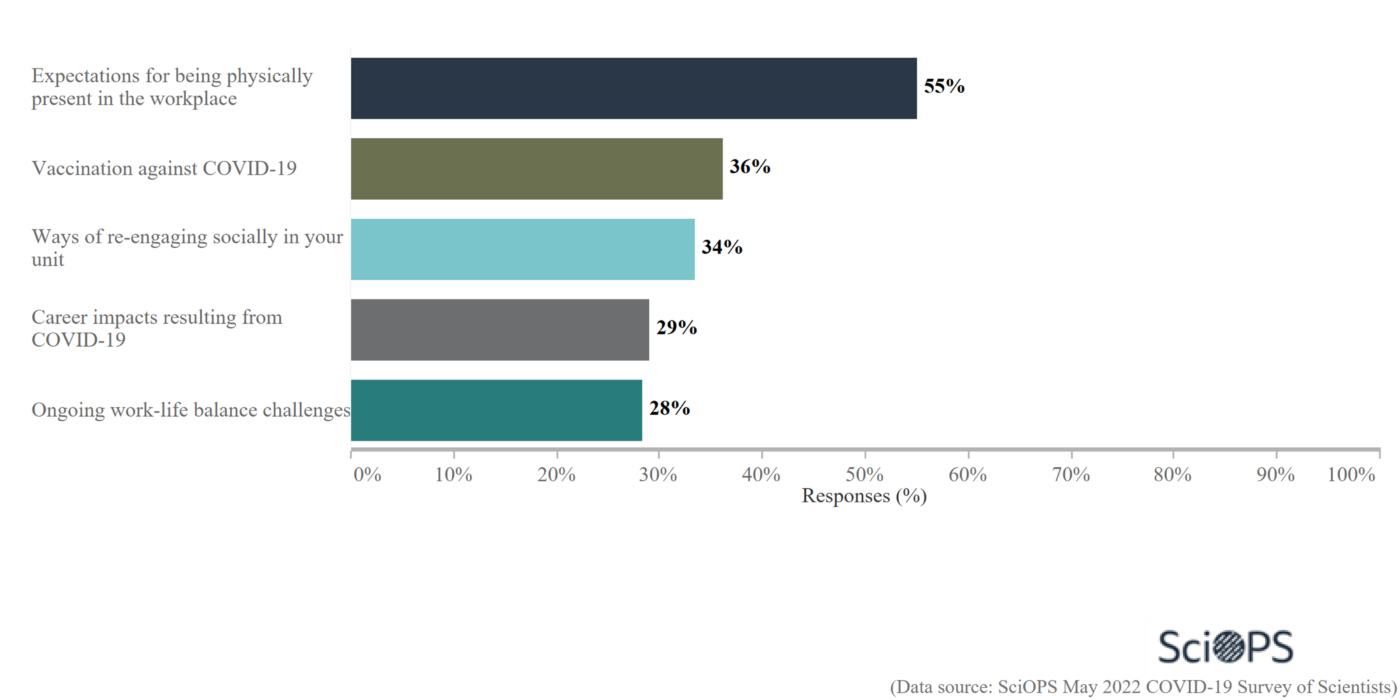
More than half of the respondents (55%) indicate that the leadership of their academic units discussed expectations for being physically present in the workplace during the spring 2022 semester. Slightly more that a quarter of the respondents (28%) reported that ongoing work-life balance challenges were discussed by the leadership of their academic units.
Question
Finding
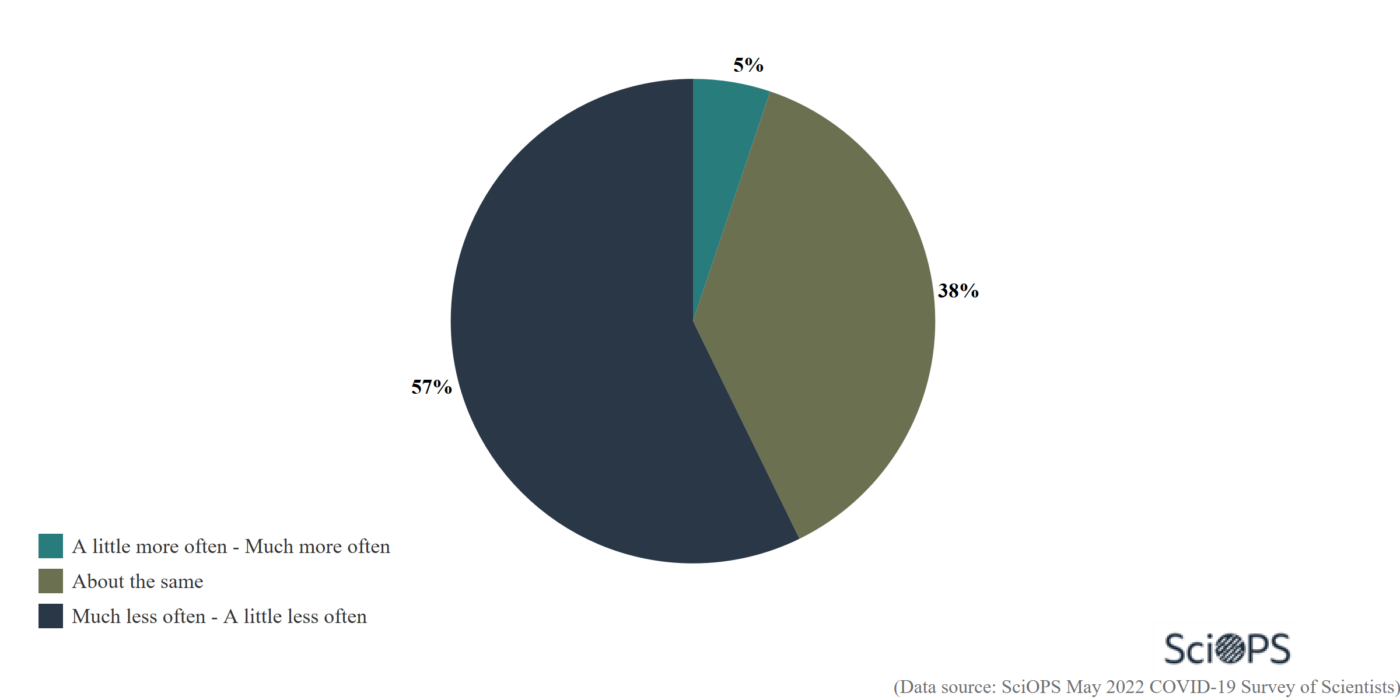
Most of the respondents (57%) indicated that compared to before the pandemic, they are going to campus much less often or a little less often. 5% reported they are going to campus a little more often or much more often as compared to before the pandemic outbreak.
Question
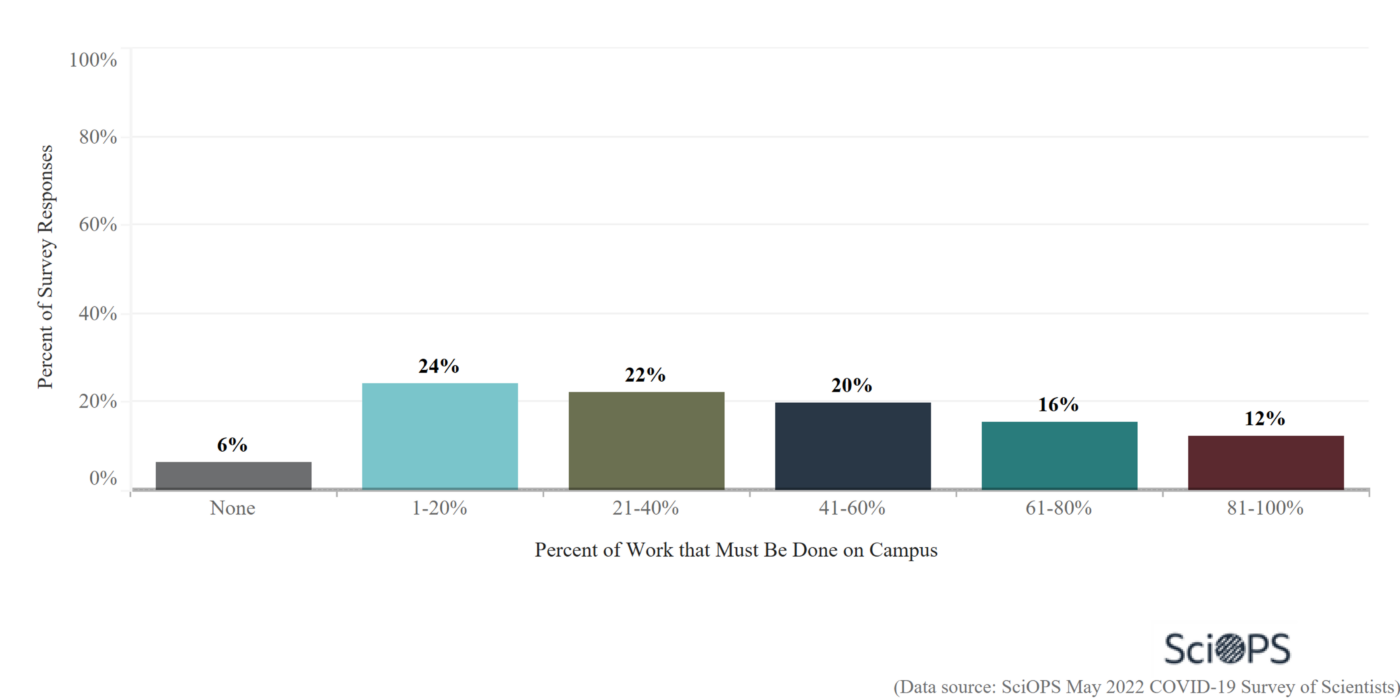
Finding
Less than a third of the respondents (30%) indicate that 20% or less of their work must be conducted at a physical worksite on the campus where they are employed. More than a quarter of the respondents (28%) report that more than 60% of their work must be conducted in person.
Question
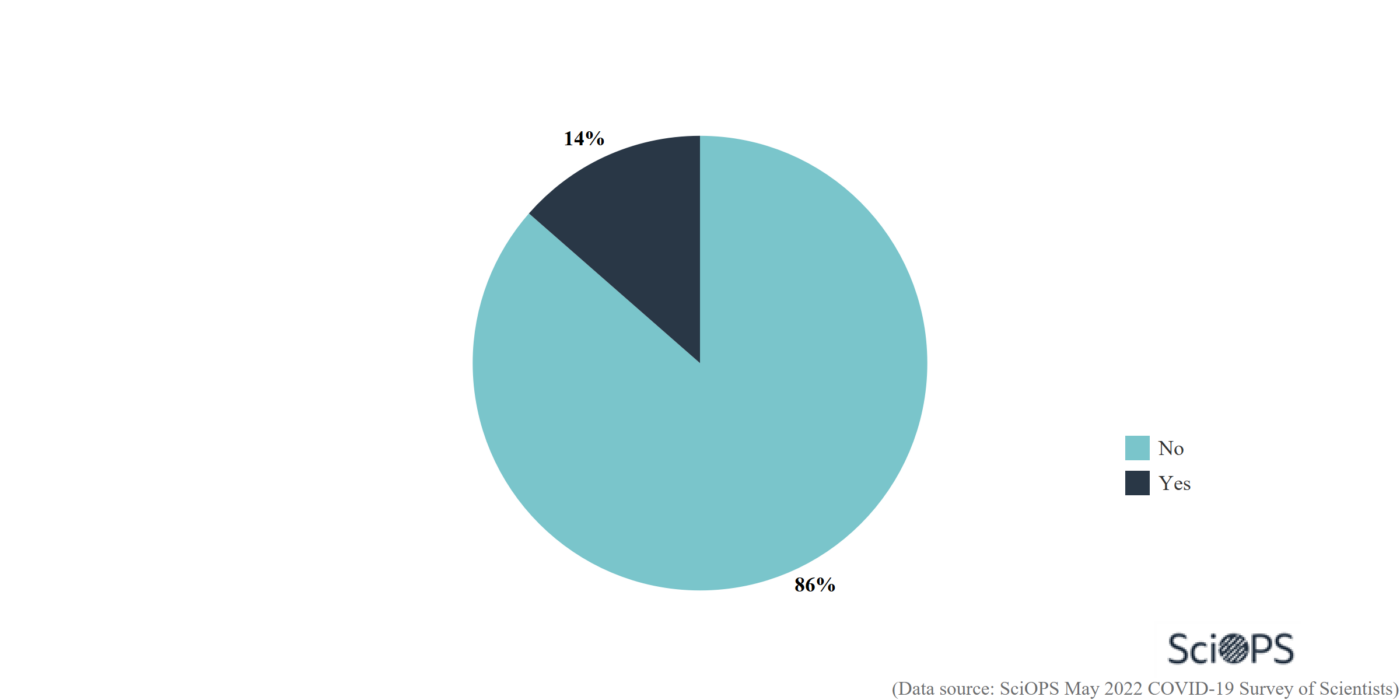
Finding
Most respondents (86%) did not move in the past two years. Of those who moved, the majority (62%) now live farther from the campus where they are mainly employed.
Question
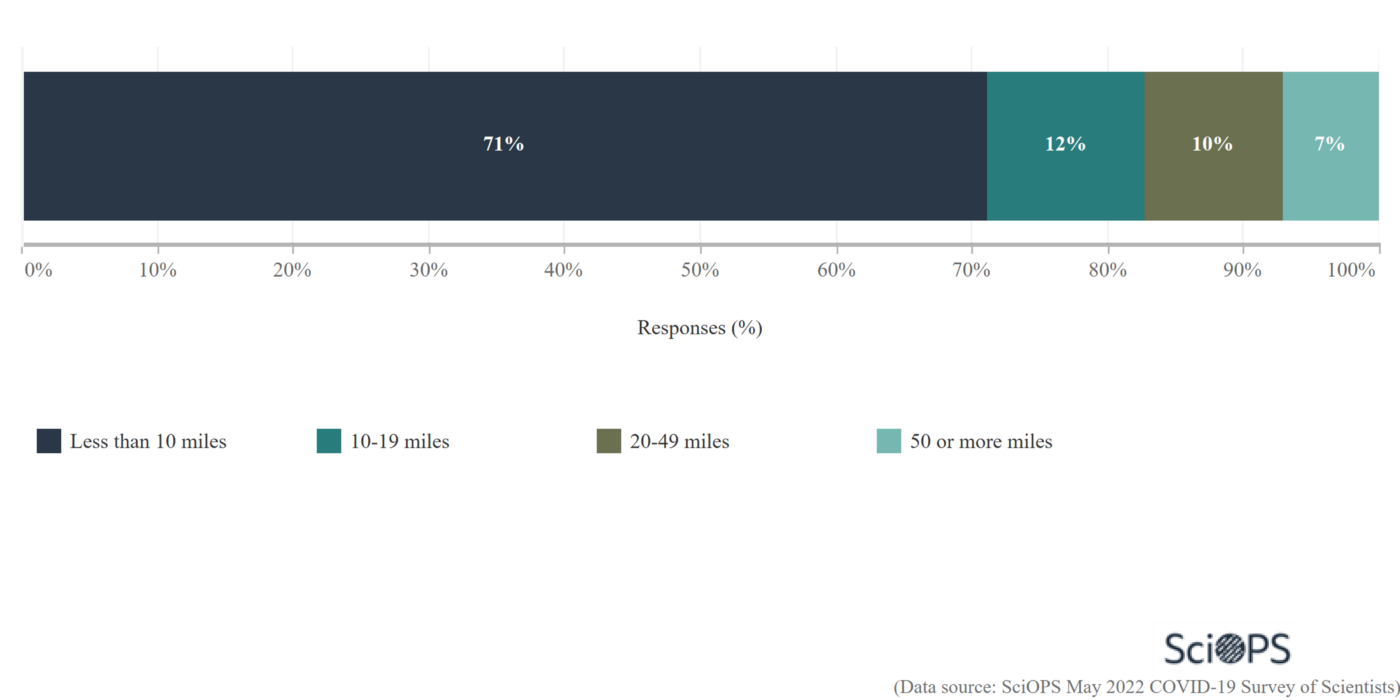
Finding
More than three-quarters of the respondents (71%) live less than 10 miles from the campuses where they are employed. Almost a tenth (7%) of the surveyed faculty live 50 or more miles away from their campuses.
Among those who indicated they moved during the pandemic (previous question), 43% currently live more than 50 miles away from the campus they are mainly employed.
Survey Description
This national survey of scientists and engineers was conducted by Center for Science, Technology and Environmental Policy Studies at Arizona State University. The population for the survey represents a random sample of PhD-level faculty in three fields of science. Three fields biology, biochemistry, and civil and environmental engineering, were collected from 61 randomly selected Carnegie-designated Research Extensive and Intensive (R1) universities in the United States (US). The final sample included contact information for 1,891 scientists. A total of 164 usable responses were obtained, representing an AAPOR response rate (RR4) of 9.06%.
Sample Weighting and Precision: the completed sample was weighted by the inverse of selection probabilities and post-stratified by gender and academic field to represent the population as closely as possible. A conservative measure of sampling error for questions answered by the full sample is plus or minus 5 percentage points. The survey was approved by Institutional Review Boards at Arizona State University and at the University of Illinois at Chicago.