Public Trust in Science: Scientists’ Involvement and Representation
The survey sample was weighted by gender and academic field to represent the population as closely as possible. The measure of sampling error for questions answered by the full sample is plus or minus 5 percentage points.
In this survey, we asked scientists about their opinions and experiences on factors that may increase or decrease the public’s trust in science. Results on this page cover questions about scientists’ direct roles and responsibilities in fostering trust. Other results from this survey about sources of science news are available here. The survey was designed in consultation with ASU’s News Co/Lab.
Question
Finding
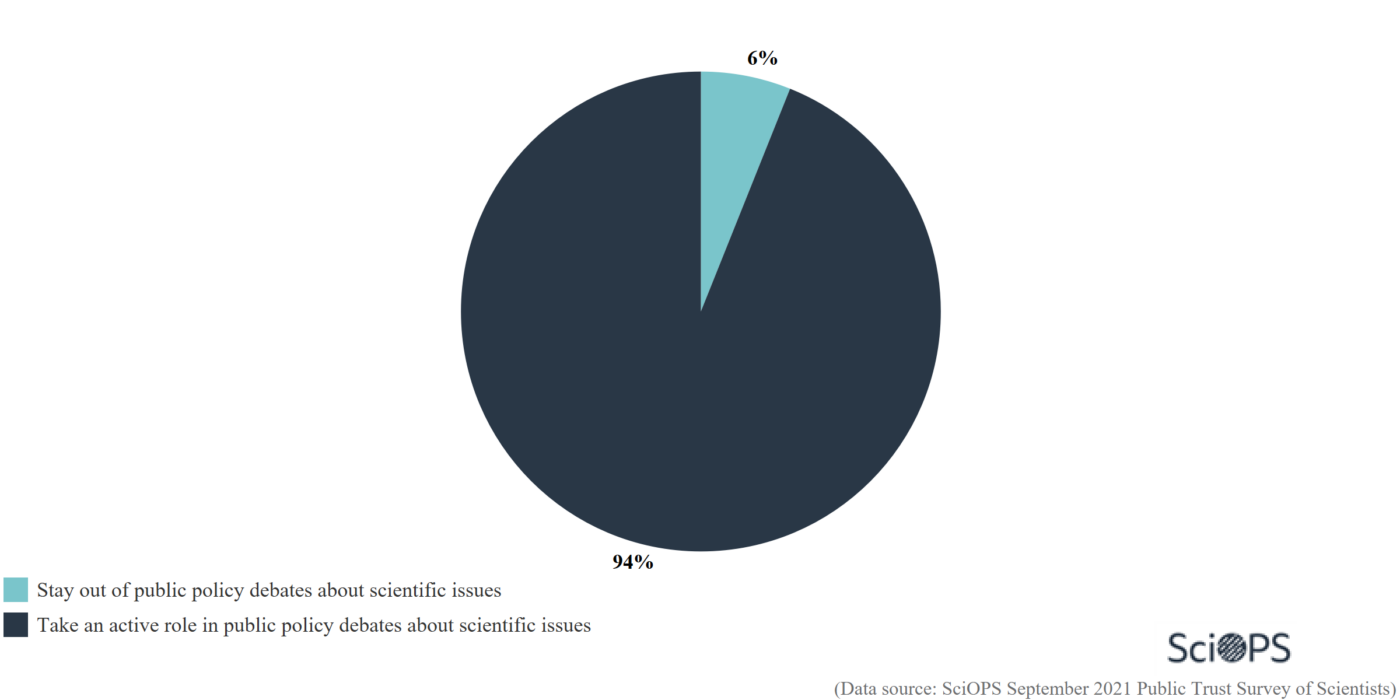
94% of respondents believe that scientists should take an active role in public policy debates about scientific issues as opposed to staying out of them.
Question
Finding
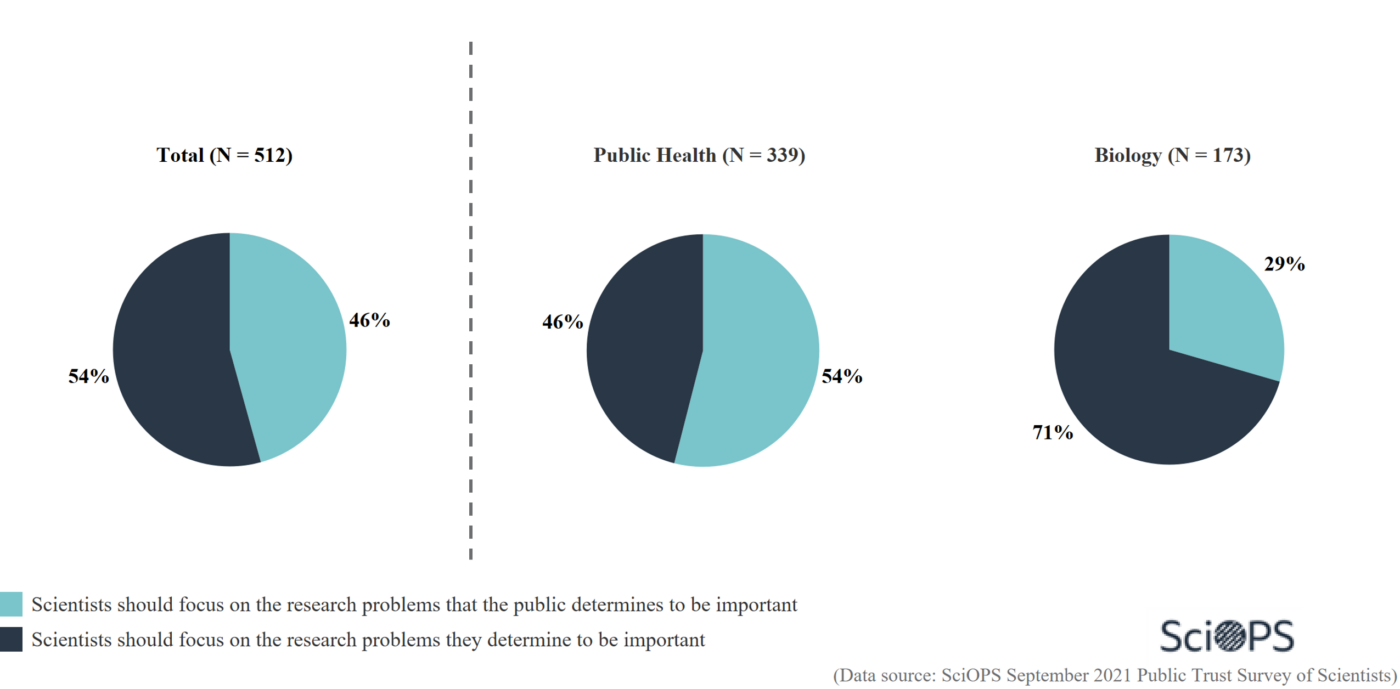
More than half of the respondents (54%) believe scientists should focus on research problems that they themselves determine to be important.
However, there are significant differences between fields (p < 0.01). The majority (70%) of biologists, but fewer than half of (46%) public health researchers believe research problems should not be determined by the public.
Question
Finding
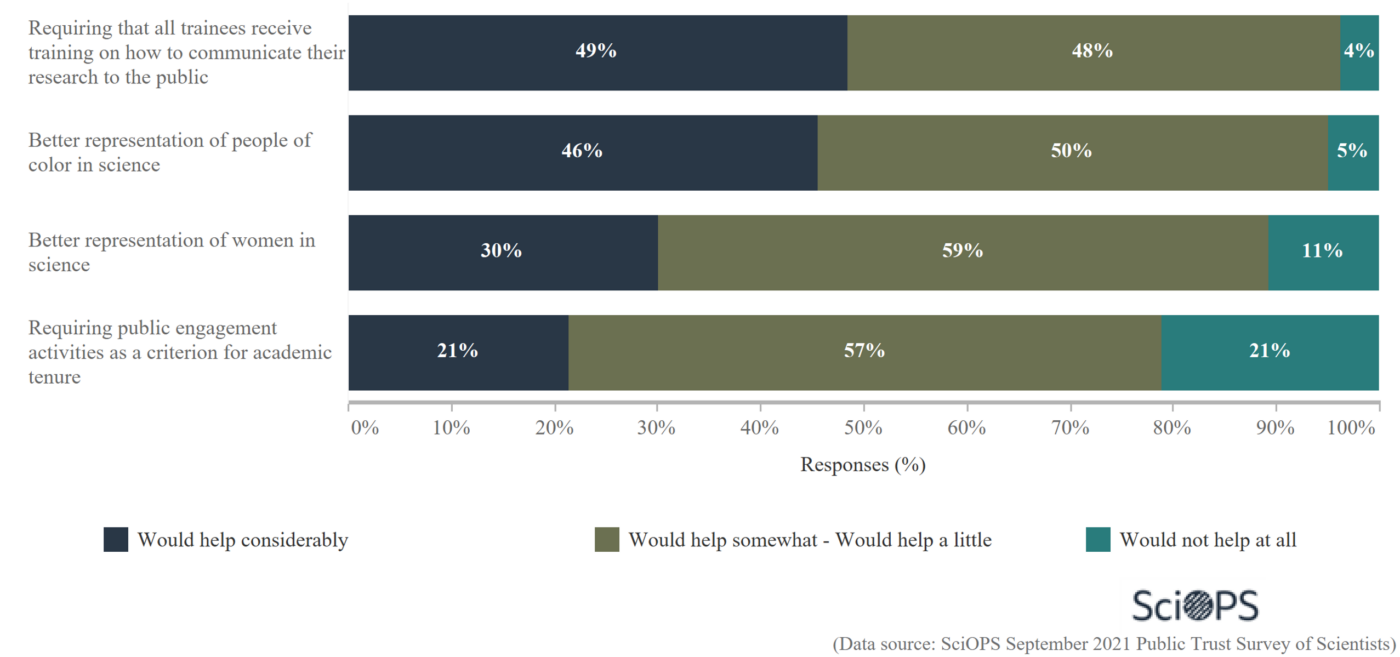
Approximately half of the respondents (49%) thought that requiring all trainees to receive training on how to communicate their research to the public would increase public trust.
46% of respondents felt that increased representation of people of color could help increase public trust. 30% of respondents believe that public trust would benefit from a better representation of women in science.
21% of respondents believe that requiring public engagement activities as a criterion for academic tenure would not help at all to increase public trust in science.
Question
Finding
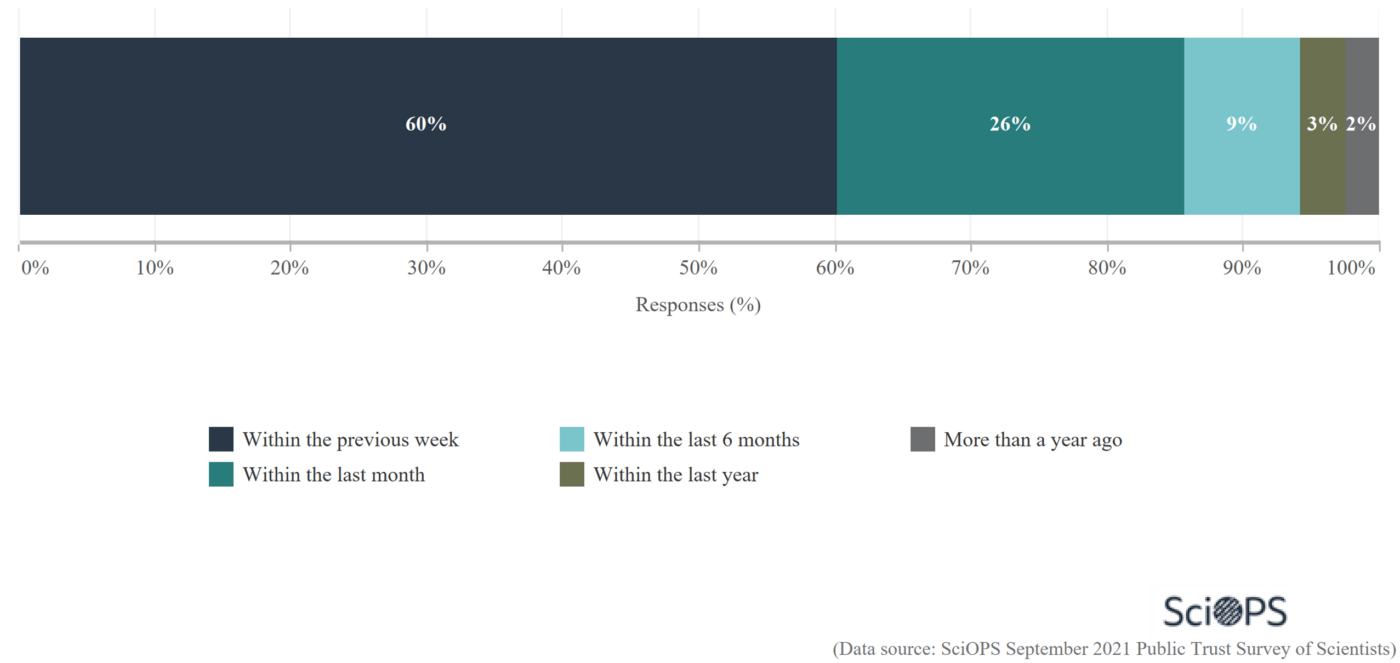
60% of respondents have spoken with a non-scientist within the previous week, 26% have done so within the previous month.
Survey Description
This national survey of scientists and engineers was conducted by Center for Science, Technology and Environmental Policy Studies at Arizona State University (ASU). The survey was designed in consultation with ASU’s News Co/Lab. The population for the survey represents a random sample of PhD-level faculty in two fields of science: biology and public health. Faculty contact information was collected from 60 randomly selected Carnegie-designated Research Extensive and Intensive (R1) universities in the United States (US) and from all CEPH accredited public health schools. The final sample included contact information for 2,551 scientists. A total of 579 usable responses were obtained, representing an AAPOR response rate (RR4) of 19.7%.
Sample Weighting and Precision: the completed sample was weighted by the inverse of selection probabilities and post-stratified by gender and academic field to represent the population as closely as possible. A conservative measure of sampling error for questions answered by the full sample is plus or minus 5 percentage points. The survey was approved by Institutional Review Boards at Arizona State University and at the University of Illinois at Chicago.