Public Trust in Science: Sources of Science News Stories
The survey sample was weighted by gender and academic field to represent the population as closely as possible. The measure of sampling error for questions answered by the full sample is plus or minus 5 percentage points.
Do stories from different media sources affect the perceived trustworthiness of science information by scientists?
To answer this question, we conducted the following experiment: Participants were randomly assigned 1 of 3 vignettes about wildland fire management. Each vignette contained the exact same content, except for a variation in reference to the vignette’s source. The three different options for sources, or treatments, were 1) a story presented by scientists, 2) a story presented by traditional media, or 3) a story presented on social media. The participants were then asked various questions about the trustworthiness of the story they just read. The below results were the statistically significant findings. The survey was designed in consultation with ASU’s News Co/Lab.
To read the full vignette and learn more, click here.
Finding
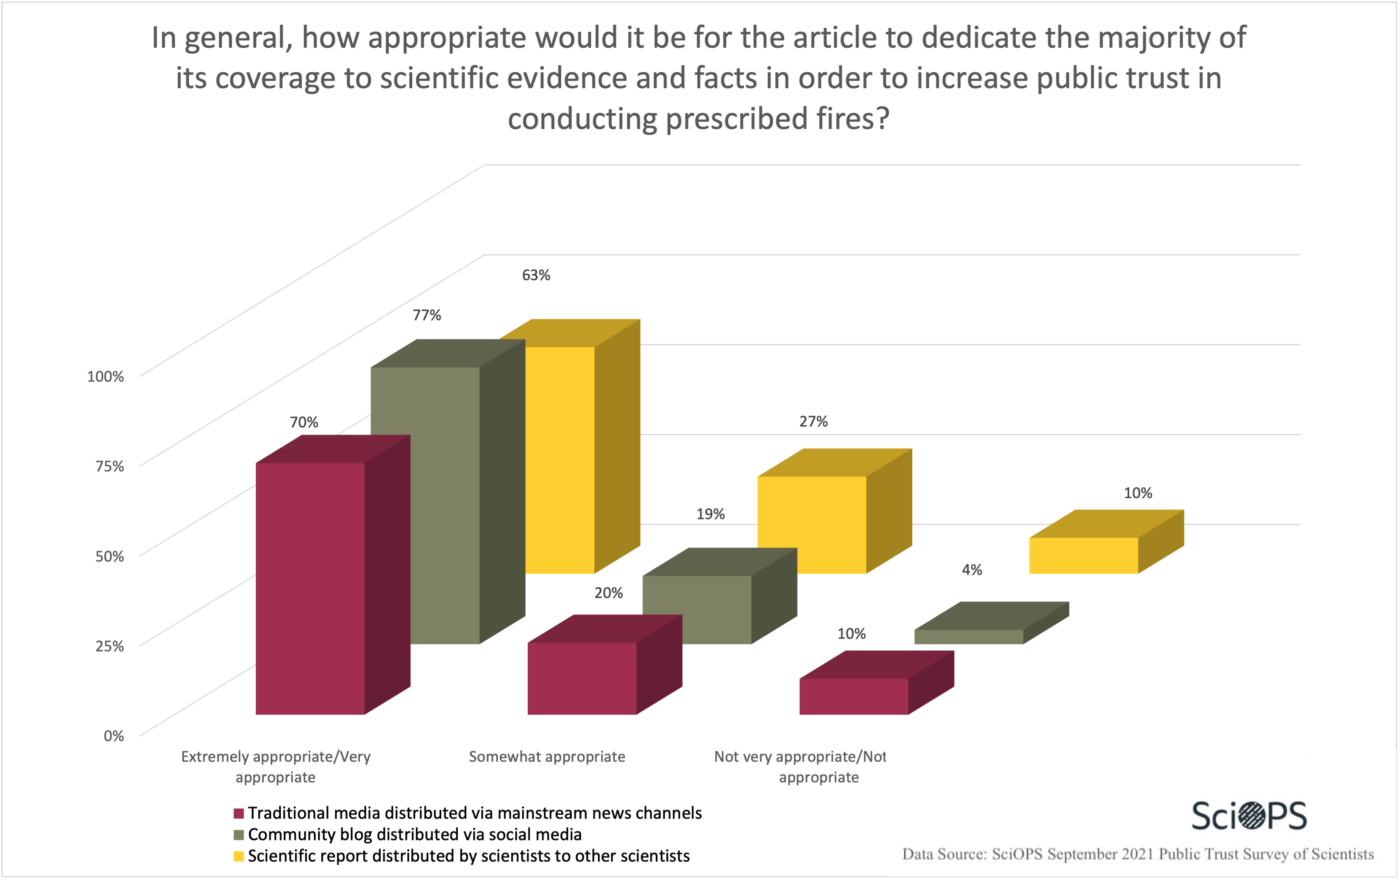
Respondents felt it was highly appropriate for blogs (77%) and media (70%) to dedicate the majority of story coverage to science fact as compared to scientific reports (63%) (This difference is statistically significant, p < .05).
Finding
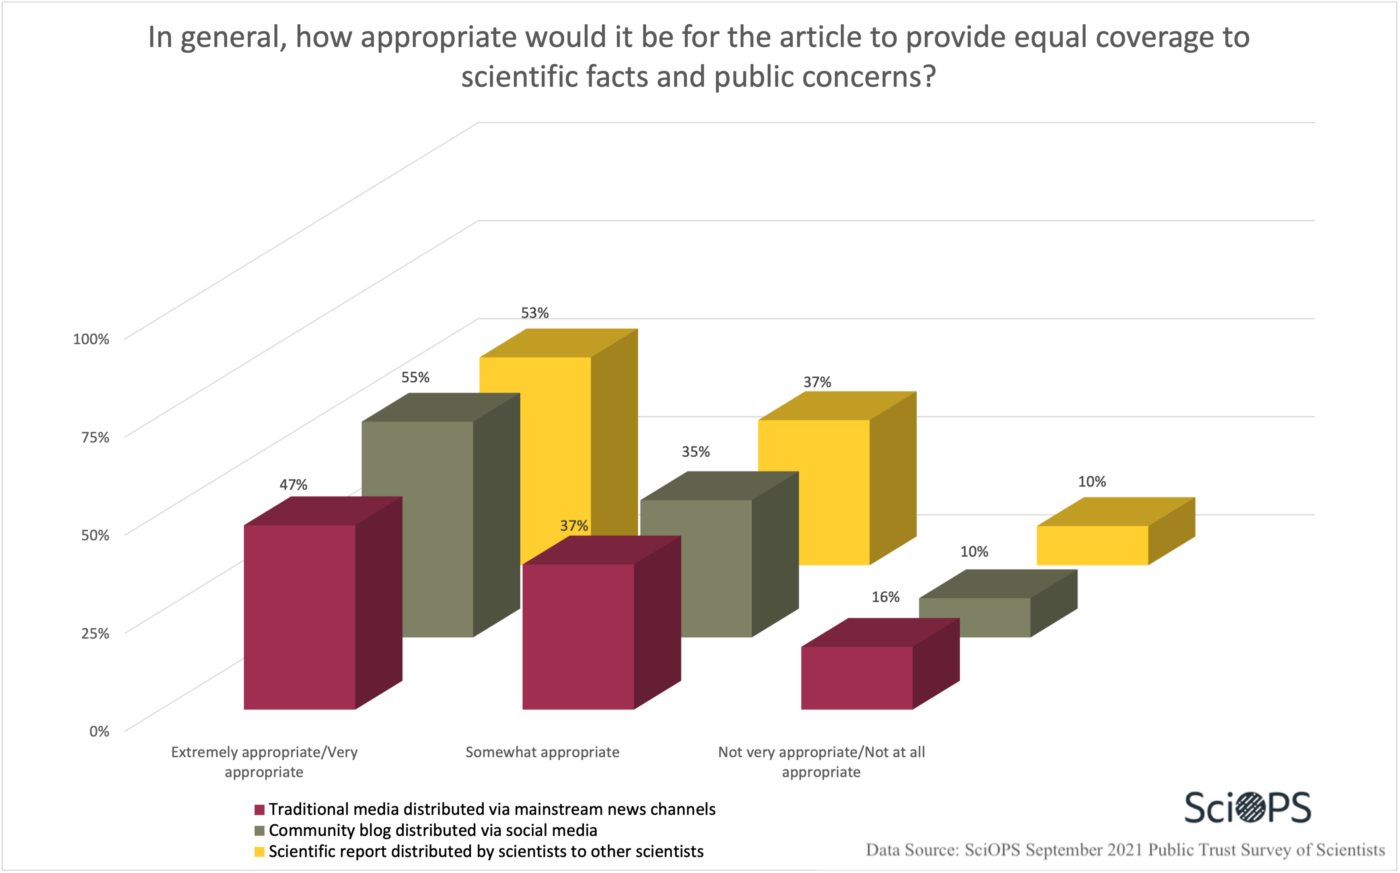
For each of the three sources (traditional media, community science blog, scientific report), about the same percentage of respondents (approximately 50%) felt that it was highly appropriate for an article from that source to provide equal coverage of scientific facts and public concerns.
However, a larger percentage of respondents (16%) felt that it was not appropriate to provide equal coverage in an article from a traditional media source, as compared to a community science blog (10%) or a scientific report (10%). (This difference is statistically significant, p < .05).
Finding
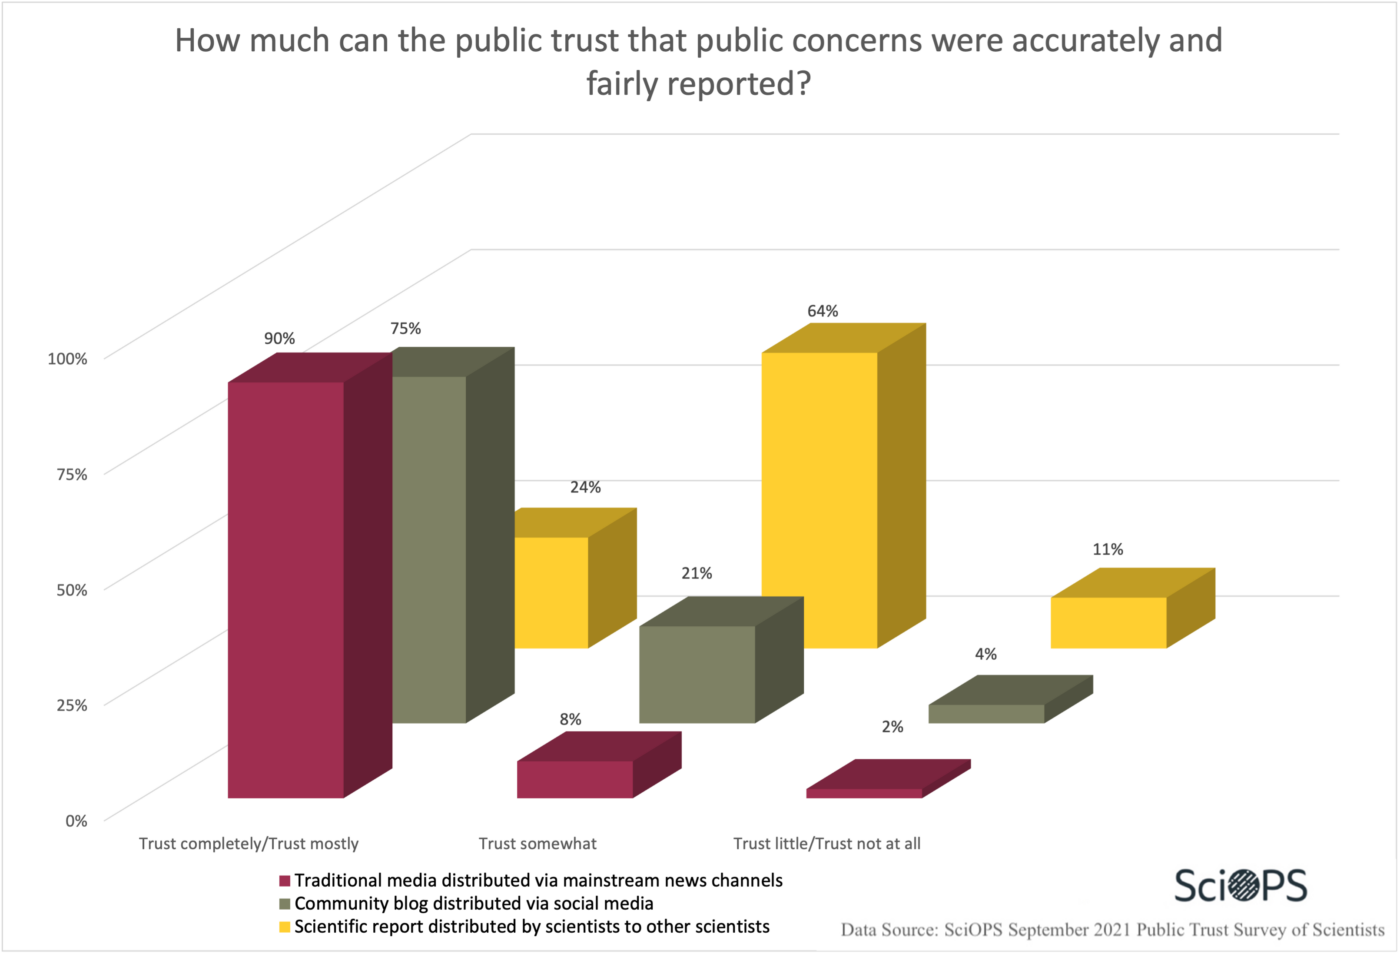
The majority of the respondents felt that traditional media (90%) and community blogs (75%) could be trusted to fairly and accurately report public concerns. 64% of respondents felt that public concerns were not well represented in scientific reports. (This difference is statistically significant, p < .05).
Survey Description
This national survey of scientists and engineers was conducted by Center for Science, Technology and Environmental Policy Studies at Arizona State University (ASU). The survey was designed in consultation with ASU’s News Co/Lab. The population for the survey represents a random sample of PhD-level faculty in two fields of science: biology and public health. Faculty contact information was collected from 60 randomly selected Carnegie-designated Research Extensive and Intensive (R1) universities in the United States (US) and from all CEPH accredited public health schools. The final sample included contact information for 2,551 scientists. A total of 579 usable responses were obtained, representing an AAPOR response rate (RR4) of 19.7%.
Sample Weighting and Precision: the completed sample was weighted by the inverse of selection probabilities and post-stratified by gender and academic field to represent the population as closely as possible. A conservative measure of sampling error for questions answered by the full sample is plus or minus 5 percentage points. The survey was approved by Institutional Review Boards at Arizona State University and at the University of Illinois at Chicago.